After you create a survey and deploy it you will be able to retrieve and analyze the results.
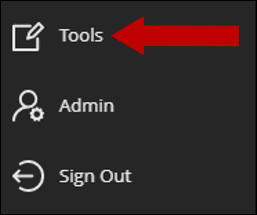
1. In the course menu, select Tools. Click on Enterprise Surveys to open the tool.
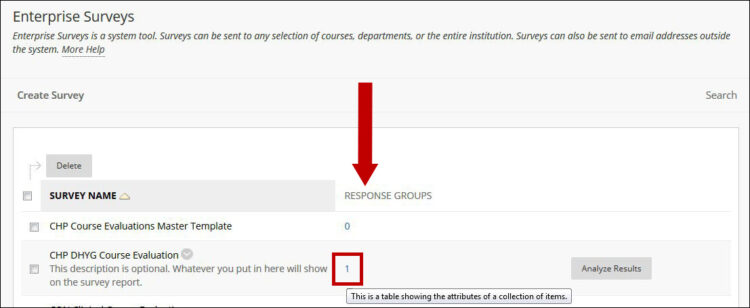
2. On the Enterprise Surveys page click the number to the right of your survey name. This will take you to the Response Periods page.
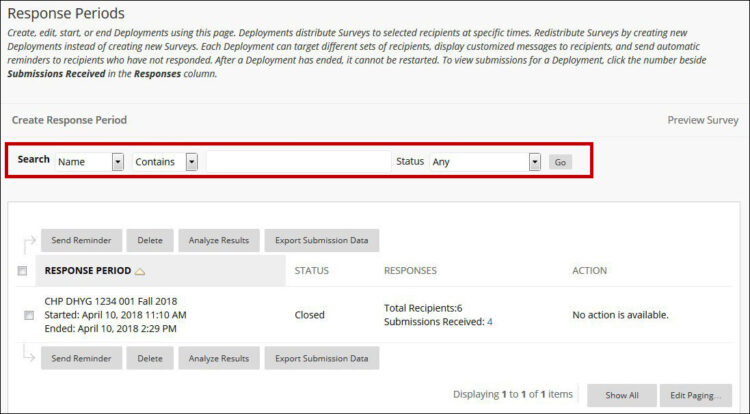
3. If necessary, enter search criteria to find your desired Response Period and click Go.
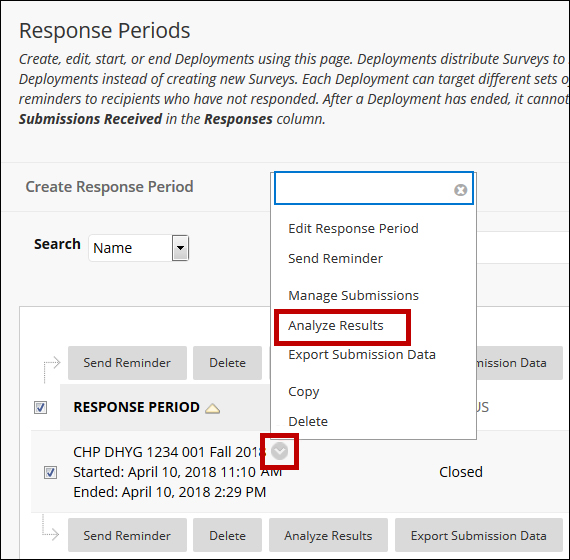
4. Hover your mouse over the desired Response Period and click the chevron
( ![]() ) for the options menu. Select Analyze Results.
) for the options menu. Select Analyze Results.
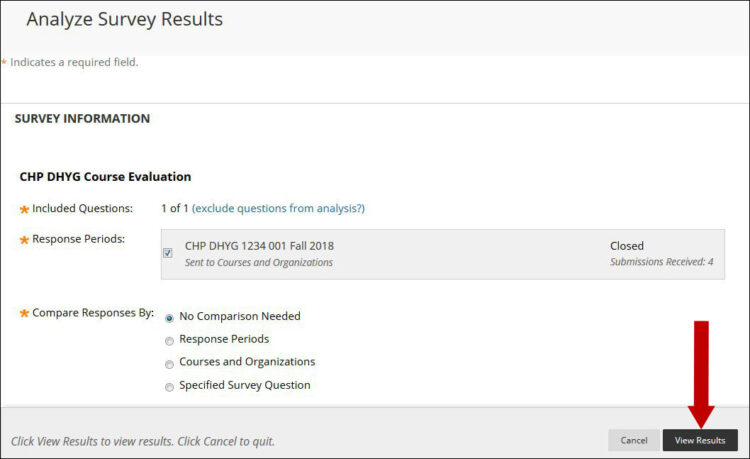
5. On the Analyze Survey Results page click View Results.
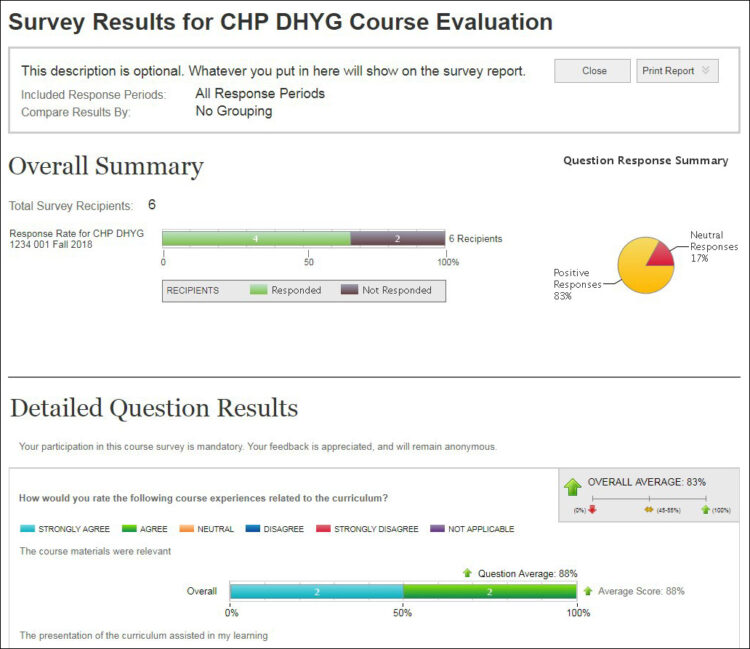
6. You should now be able to see the Survey Results.
7. If you need to save and/or send a report as a PDF file, use the Print Report feature.
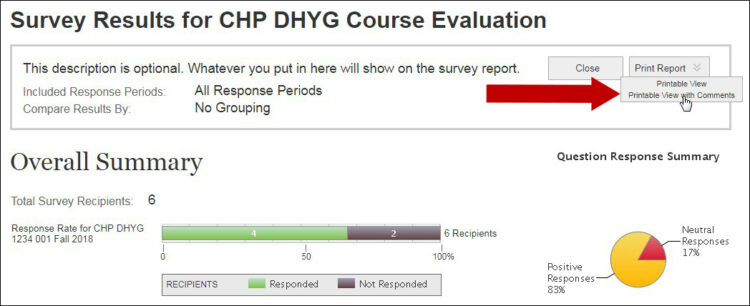
Note: Printable View with Comments will include students’ comments from the open response questions.
